
The difference between mean median and mode is simple. The mean combines all numbers then divides by the count of numbers. After you sort the list, the median is the middle value. The mode is the most frequently occurring number or item.
These three concepts let you grasp data quickly. Read exam marks, prices, or poll results using them. The mean might vary greatly if a few numbers are exceptionally huge. The middle stays close. The mode reveals the preference of most people.
Main Difference Between Mean, Median and Mode
The main difference is what each measure uses. The mean uses every number. The median uses the middle position. The mode uses how often a value appears. Use the mean for even data. Use the median when there are extreme values. Use the mode for categories or repeated answers.
Mean Vs. Median Vs. Mode
What is Mean
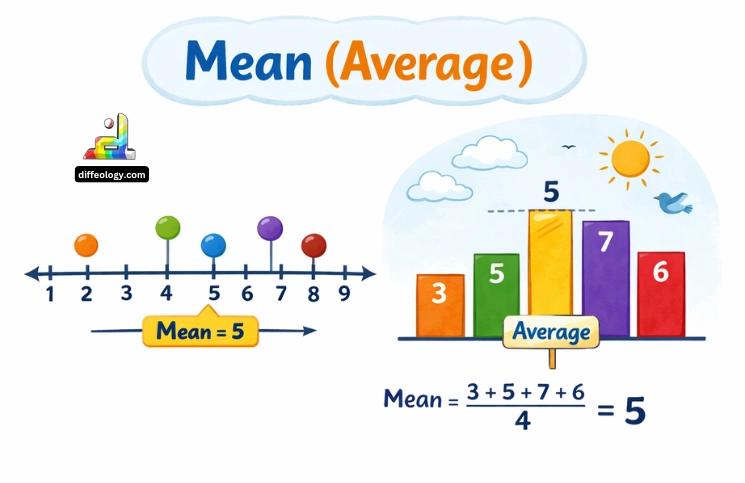
Average is mean. Get it by dividing the sum of all numbers by the count of numbers there. Five scores—60, 65, 70, 75, 80—for example have an average of 70 since (60+65+70+75+80)/5=70. With Microsoft Excel or a Calculator, finding the mean is simple.
- Uses: class averages; simple reports.
- Limits: one very large or very small number can change the mean a lot.
Read Also: Difference Between Mean and Median
The mean is good when numbers are close to each other. If a few values are very high, the mean may not show what most people have.
What is Median
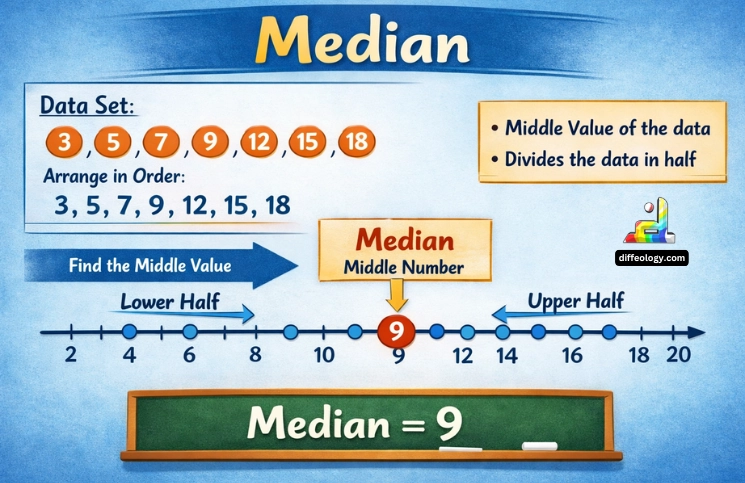
The middle is the median. Sort the numbers in ascending order. Choose the middle one. Average two middle numbers if there are two. The median is 30, for instance, in 10, 20, 30, 40, 100 even if the mean is 40. When data are not even, the median is high.
- Uses: typical income or house price; when data are skewed.
- Limits: it ignores most exact values; it only uses position.
Read Also: Difference Between Rational and Irrational Numbers
You can find the median with Google Sheets, Python, or by hand for small lists.
What is Mode
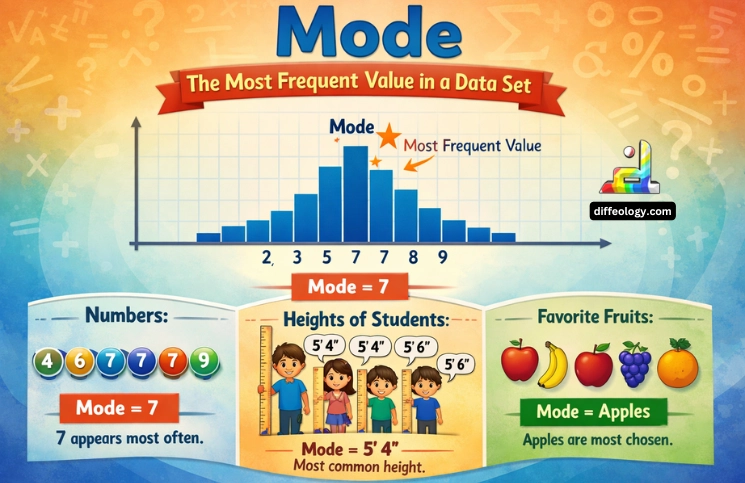
The mode is the most common value. In answers like yes, no, yes, yes, maybe, the mode is yes. Numbers can have one mode, more than one mode, or no mode at all.
- Uses: surveys, polls, most common size or choice.
- Limits: may not exist; may not tell about spread.
Read Also: Difference Between Average and Median
The mode is useful with categories. Use R or Python to find the mode in big data.
Comparison Table “Mean Vs. Median Vs. Mode”
| Definition | Average of all numbers | Middle number when sorted | Number that comes most often |
| How to Find | Add all numbers, divide by count | Arrange numbers, pick the middle | Look for the most repeated number |
| Example (2, 3, 3, 6, 7) | (2+3+3+6+7)/5 = 21/5 = 4.2 | Middle = 3 | Most repeated = 3 |
| Best Use | Shows overall average | Good for ordered data | Good for finding common value |
| Effect of Big/Small Numbers | Can change a lot if one number is very big or small | Not much affected | Not affected |
| Type of Data | Works with all numbers | Works with ordered numbers | Works with repeated numbers |
| Real-Life Example | Average marks in class | Middle income in a city | Most popular shoe size |
Difference Between Mean, Median and Mode in detail
Get to know the Difference Between Mean Vs. Median Vs. Mode in Detail.
1. Sensitivity to outliers
Any change in a value affects the mean. The mean can be dramatically shifted by one really big or very small number. For instance, wages 20,000; 25,000; 30,000; 35,000; 1,000,000 produce a mean that appears much beyond what most people earn.
When one value is extreme, the median hardly varies. It remains toward the center. News therefore frequently employs the median for home prices or pay.
2. Use with categories
The mode works with words and categories. For example, colors red, blue, red, green, red have mode red. The mean and median do not work with words.
When numbers repeat, the mode shows the most common number. This helps in stores to see the most sold shoe size.
3. How to calculate
The mean needs addition and division. It is quick with a Calculator or Microsoft Excel.
The median needs sorting and picking the middle. The mode needs counting how often each value appears.
4. What each measure uses
The mean uses all values. The median uses order and position. The mode uses frequency.
This means the mean shows the total balance, the median shows the midpoint, and the mode shows the most common result.
5. Behavior on symmetric vs skewed data
On symmetric data, the mean, median, and mode are often close. On skewed data, the mean moves toward the tail. The median stays near the center. The mode shows the peak.
So for a bell curve, any measure works. For income or price data, the median is often best.
6. Uniqueness and multiple modes
One number each is provided by the mean and median. The mode can be one, two, several, or none.Two values tying for the most frequent make a dataset bimodal.
Multiple modes can show two popular groups in the data.
7. Practical reporting and choice
Use the mean for averages like class marks or average temperature. Use the median for typical income or house price. Use the mode for the most common choice in a poll.
Often, showing all three gives the clearest view of the data.
Key Difference Between Mean, Median and Mode
Here are the key points showing the Difference Between Mean Vs. Median Vs. Mode.
Data used
- Mean uses all numbers; median uses order; mode uses frequency.
Outlier effect
- Mean is sensitive; median resists outliers.
Type of data
- Mean and median need numbers; mode works with words.
Uniqueness
- Mean and median give one number; mode can be many or none.
Calculation
- Mean = sum ÷ count; median = middle value; mode = most frequent.
Even count median
- With an even number of items, median is the average of the two middle values.
Skewed data
- Median better shows center for skewed data than mean.
Symmetric data
- On symmetric data, mean, median, and mode are similar.
Interpretation
- Mean shows balance; median shows midpoint; mode shows popularity.
Use in income
- Median is often used to report typical income.
Use in surveys
- Mode shows the most chosen option.
Robustness
- Median is robust to extreme values; mean is not.
Multiple peaks
- Mode can show multiple common values (bimodal).
Teaching order
Mean is usually taught first in school.
FAQs: Mean Vs. Median Vs. Mode
Technologies That Help Find Mean, Median, and Mode
You can use many tools to find these measures. Here are common ones:
- Calculator — quick for small lists.
- Microsoft Excel — use AVERAGE, MEDIAN, SNGL functions.
- Google Sheets — same functions as Excel.
- Python — use libraries like pandas or statistics to compute them fast.
- R — use built-in functions for mean, median, and mode.
- TI-84 (or other graphing calculators) — good for class work.
All these tools make the work faster. For big data, use Python or R. For quick school work, use Calculator or Microsoft Excel.
Conclusion
Using the difference between mean median and mode helps you pick the right number. This number will show what data mean. Use mean for balanced sets, median when there are extremes. You can use the mode to show the most common choice. When you show all three, people can see the full story.