
In any test, researchers change one thing on purpose and watch another thing vary to see what happens. This cause-and-effect setup shows up in about 100% of science experiments. The item adjusted is the independent variable. There is a big Difference Between Dependent and Independent Variable. The feature measured is the dependent variable. Common tools for handling and analyzing these factors include R, Python, SPSS, Excel, MATLAB, STATA, SAS, GraphPad Prism, Tableau, and Power BI.
Using these tools helps run tests, record data, and draw charts easily. Clear planning and proper tools make experiments reliable and repeatable.
Main Difference Between Dependent and Independent Variable
The independent variable is what you choose to change by design. The dependent variable is the result you track and measure. Together, they form the core of any experiment, showing how one factor affects another.
Dependent Vs. Independent Variable
What Is Dependent Variable
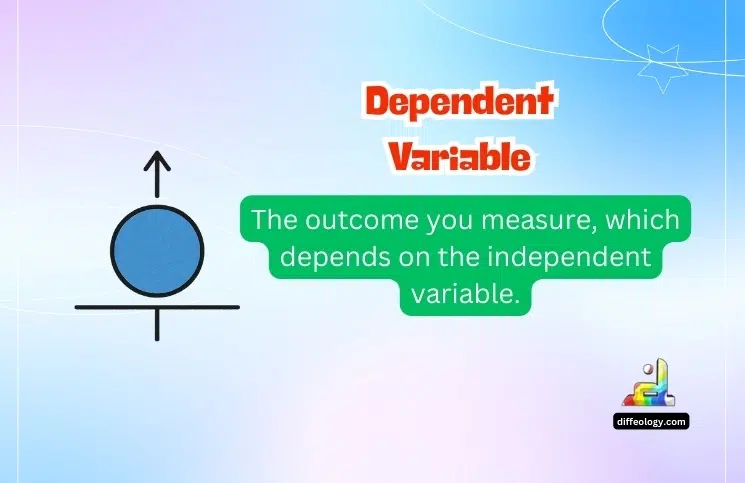
The dependent variable is the outcome you measure in a study. It depends on the independent variable you change. For example, if you vary light for plants, the plant height you record is the dependent variable. This height may rise or fall based on your change. Scientists use simple tools to record these results and test ideas.
Read Also: Difference Between Celsius and Fahrenheit
Graphs show the dependent variable on the vertical axis marked Y. Each plotted dot reveals how much that variable shifts when you adjust the cause. Precise readings of this variable ensure you can trust your findings. Clear measurement helps you confirm or reject your hypothesis.
What Is Independent Variable
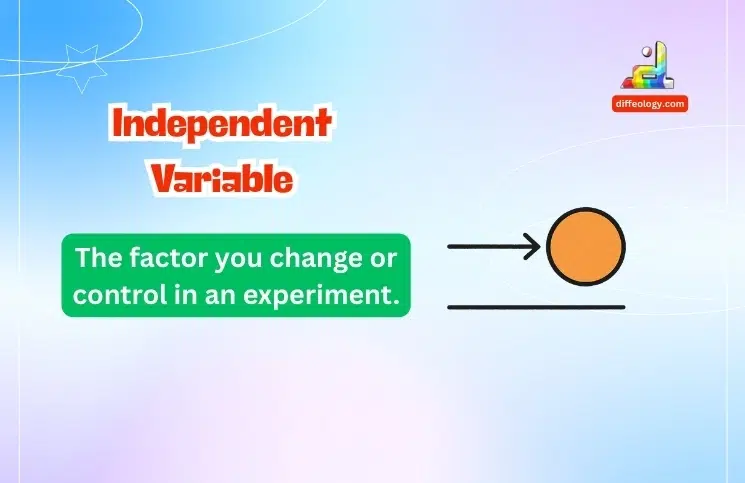
The independent variable is the factor you set or change on purpose. It stands alone and does not rely on other parts of the study. For example, if you give people different amounts of sugar, those sugar amounts are the independent variable. You choose the exact doses to test how they affect blood energy.
Read Also: Difference Between Discrete and Continuous Data
In charts, the independent variable sits on the horizontal axis marked X. By picking levels for this variable, you can link each level to the outcome in the dependent variable. This link makes it easy to see the effect of your choices.
Comparison Table “Dependent Vs. Independent Variable”
| Definition | Outcome measured in a test | Factor changed by the researcher |
| Role | Shows the effect | Acts as the cause |
| Control | Only observed | Actively set |
| Axis Placement | Vertical axis (Y) | Horizontal axis (X) |
| Label | Y | X |
| Manipulation | Not changed | Changed by design |
| Data Use | Response data | Predictor data |
Detailed Difference Between Dependent and Independent Variable
Get to know the Difference Between Dependent Vs. Independent Variable in Detail.
1. Purpose in Research
The independent variable is the cause you control to test an idea. For instance, you might change water temperature to see how fast yeast reacts. Researchers set the values to explore how one thing affects another. Good control helps keep tests fair and clear.
The dependent variable is the effect you measure to spot results. In the yeast test, the gas volume is the dependent variable. You track the volume to see if higher heat speeds up the reaction. This result shows whether your idea is valid.
2. Control Versus Observation
Researchers fully control the independent variable. They pull levers, turn dials, or enter numbers into software. For instance, you may use MATLAB to set exact pH levels in water. This makes sure you repeat the same setup each time.
When it comes to the dependent variable, researchers only observe or measure. They record the changes without further intervention. A pH meter might log the acidity every minute. This observation tells you how the system reacts.
3. Labeling in Analysis
In math and charts, the independent variable is labeled X. It is the input you feed into formulas. Models use this input to predict outcomes. For example, a regression in SPSS might use study hours as X.
The dependent variable is labeled Y. It is the output you record. Plots show how Y shifts when X moves. Analysts compare predicted Y values to real ones to see if models work well.
4. Examples in Real Tests
If students study for 1, 2, or 3 hours, study time is the independent variable. Their quiz scores are the dependent variable. You can see if more study leads to higher marks by plotting time versus score.
In drug trials, dosage is the independent variable. Patient recovery rates are the dependent variable. By changing dose levels, doctors check which dose helps best. Clear results guide safe treatment plans.
5. Role in Data Analysis
Statisticians use independent variables to predict outcomes. They call these predictors or factors. In R, you might include age, diet, and exercise as Xs to predict weight loss.
Dependent variables are the targets in these predictions. Analysts use recorded outcomes to train models. Better model fit gives more reliable forecasts.
6. Experimental Versus Observational Use
In controlled tests, you set the independent variable directly. You pick temperature, dose, or light level. This gives tight control over the cause.
In surveys, independent variables can be traits like age or gender. You do not set them, but you can still test their link to outcomes. This helps study real-world groups.
7. Impact on Study Design
Choosing a clear independent variable guides your whole setup. It affects sample size, tools like Excel or Tableau, and timing. A weak variable choice leads to unclear data.
Picking a reliable dependent variable is key for strong results. It needs good measurement tools. Poorly measured outcomes can wreck your conclusions.
Key Difference Between Dependent and Independent Variable
Here are the key points showing the Difference Between Dependent Vs. Independent Variable.
- Definition: The independent variable is what you change; the dependent variable is what you measure. You pick one thing to adjust and another to track for results.
- Cause and Effect: Independent variables cause shifts; dependent variables show those shifts. This link forms the basis of tests that prove cause and effect.
- Control: Researchers set the independent variable; they only watch the dependent one. Setting values makes tests fair; watching ensures you record the outcome.
- Graph Axes: Independent variables go on the X-axis; dependent variables go on the Y-axis. This standard helps you read charts quickly.
- Labels: Independent variables are labeled X; dependent variables are labeled Y. This rule keeps math and plots simple.
- Manipulation: Independent variables are changed by design; dependent variables are not. You handle the cause; you only handle the measurement of the effect.
- Measurement: Dependent variables are recorded with tools; independent ones are set in advance. A pH meter logs acidity; a lab pump sets flow rate.
- Prediction: Independent variables serve as inputs; dependent variables serve as outputs. Models use inputs to guess the outputs, then check if they match.
- Number of Variables: Tests can have many independent variables; usually one main dependent variable. Tracking too many outcomes can complicate data.
- Type: Independent variables can be categories or numbers; dependent variables are always outcomes. Categories might be colors; outcomes might be response times.
- Research Questions: Questions ask how changes in the independent variable affect the dependent variable. Clear framing helps you design a good test.
- Tools: Software like SAS shapes inputs; tools like GraphPad Prism record outputs. Good tool choice makes data work easier.
- Hypotheses: Hypotheses state how you think X will change Y. Writing this down guides your test plan.
- Reproducibility: Clear independent and dependent variables help others repeat your test. This builds trust in your results.
FAQs: Dependent Vs. Independent Variable
Conclusion
Knowing the difference between dependent and independent variable guides every part of a test. You set the independent variable as the cause, and you measure the dependent variable as the effect. This clear link helps you plan, run, and repeat experiments. It shows what you must change and what you must measure for solid results. It is the heart of the scientific method and key to finding real answers.
References & External Links
- Variables in Research | Definition, Types & Examples